
API latency under load
Three providers, one data pipeline, and a controlled stress test to find where the latency curve breaks. Results are unfiltered.
3
providers tested
14d
run duration
~2M
requests logged
The setup
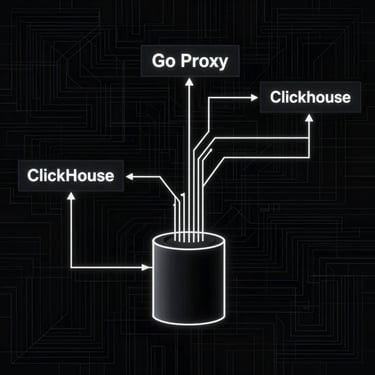
Instrumentation ran through a thin Go proxy that stamped each request with provider ID, timestamp, and response code before writing to a local ClickHouse instance. No SDK wrappers — raw HTTP only, so the numbers reflect wire latency, not client overhead.
The hypothesis: provider-advertised p99 latency numbers collapse under sustained concurrent load. Each provider was hit with identical payloads at 50, 200, and 500 requests per second across a 14-day window.
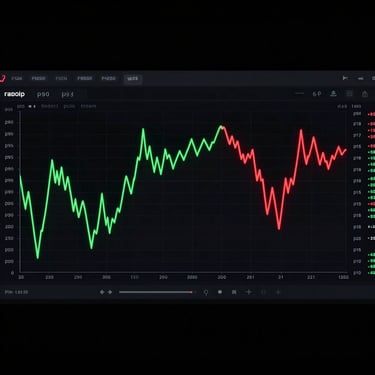
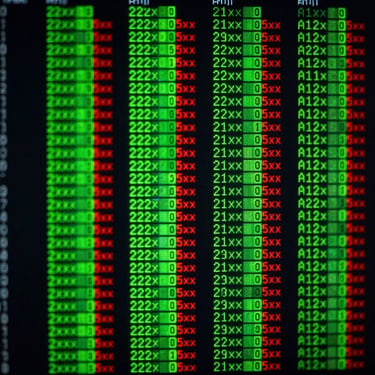
Provider C breaks at 200 rps. The others hold — barely.
Advertised p99 figures held at 50 rps. Above 200, Provider C degraded to 4× its baseline. Providers A and B stayed within spec but showed measurable drift past 400 rps. Raw logs and the proxy source are in the repo.
entrepid.dev
© 2026 entrepid.dev-System online. Deployments active.